
plot 할 때 원하는 label을 지정
Legend에 표시하고 싶은 내용을label인자에 입력해주면 된다.
d10_ft = check3[(check3['choice'] == 1)&(check3['decile'] == 10)]['TOTL_SQ_FT_CNT']
d1_ft = check3[(check3['choice'] == 1)&(check3['decile'] == 1)]['TOTL_SQ_FT_CNT']

f, ax = plt.subplots(1, 1)
sns.distplot(d10_ft, label = 'decile 10',ax=ax)
sns.distplot(d1_ft, label = 'decile 1',ax=ax)
ax.legend()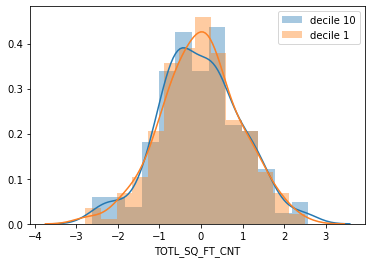
참고
How to add legend to seaborn multi-dist plot without putting the data together
I have a two series of data that i'm displaying on one seaborn histogram using the following code: import pandas import seaborn d10_ft = check3[(check3['choice'] == 1)&(check3['decile'] == 10...
stackoverflow.com